Audit report
Plots by status, main anomalies, a map of forest alerts and actions to take. Written for management.
Every supplier plot checked against the EUDR rules, rejections fixed before you submit, and doubtful plots surveyed in the field with GNSS receivers.
Built for exporters, cooperatives, and European importers

Around twenty checks replay the EU Information System’s validation rules on every plot: coordinates, geometry, data types and size limits. What can be fixed safely is fixed and logged.
Plot record · Example
LOT CI-0482 · Cattle · 3.2 ha
Illustrative results only; they do not constitute regulatory validation.
Compliant
Straight to the export file
Screen review
An analyst decides on imagery.
Field check
A mission is created.
Every decision is stored with the plot, the imagery viewed, and the reason.
Each plot gets a risk score and one clear status. Clean plots go straight through, and expert attention goes only where judgement matters.
Illustrative workflow only: the displayed data, plots, and suppliers are fictional.
Every outline is graded on its shape, its accuracy and how it fits with neighbouring plots. Small errors are corrected on screen. Weak outlines go straight to a GNSS field survey, so you only remap what needs it.
Plot quality
Sample dataCI-0482
Cocoa · 3.2 ha
Clean outline, area matches declaration
CI-0517
Cocoa · 1.8 ha
Spikes from GPS drift on two vertices
CI-0533
Cocoa · 4.6 ha
GPS point only, plot over 4 ha
CI-0541
Cocoa · 2.1 ha
Overlaps a neighbouring plot
Actions are simulated in this mock-up; no survey is changed or submitted.
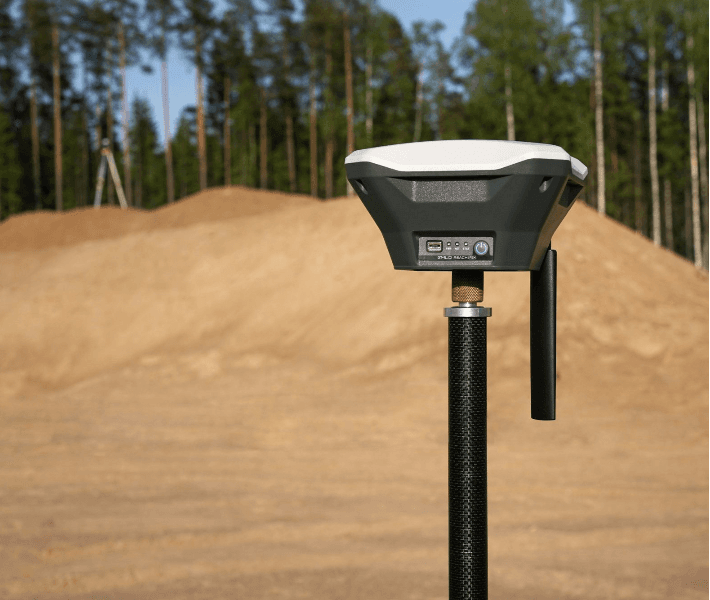
A phone’s GPS can drift by several metres, and more under cocoa canopy. The polygon passes every format check, yet misses the real boundary. A field survey with GNSS receivers and real-time corrections gives you an outline that matches the land.
Phone GPS track
AutonomousGNSS survey
RTK fixedField mission
Every check has a code, a source and a threshold you can read, so your GIS team, and any authority, can audit every decision.
Read the methodology →Plots by status, main anomalies, a map of forest alerts and actions to take. Written for management.
Compliant plots only, in the EU Information System format, Type I and Type II, split to its limits.
Status, score, anomaly codes, corrections and every human decision. Your evidence if an authority asks.
Deliverables are defined according to each engagement’s scope and needs.

“A customer testimonial will be added here, in their own words and reflecting their real experience.”
—
Plots audited
Real figure to be provided—
Field agents
Real figure to be provided—
Cooperatives
Real figure to be provided—
Countries
Real figure to be providedFor compliance and procurement teams
Get a useful audit and the information you need—without opening a map.
Explore services →For GIS and data teams
Agreed formats, versioned rules, and anomaly codes your analysts can reuse.
Explore technology →Send a sample lot and get every issue listed, with the reason and the fix.